
The published paper of this work can be found in IEEE Xplore digital library.
Hi, there! This is my first academic blog. What I’m going to introduce is the temporal, spatial and linguistic analysis of over 270 thousand 2019-Chinese-Natioinal-Day-related tweets written in English and Chinese. These data was collected using Twitter API from 30 September to 3 October, and the total number of tweets collected was 311,935. 246,602 of them were written in English, and another 5,150 were in Chinese (traditional and simplified). The data of 29 September as well as from 5 October to 8 October was also separately collected.
1. Aims
I decided to collect and analyze the data because I was interested in how the expressed sentiments on Twitter towards China would be during such a grand occasion. Also, I want to observe the fluctuation of overall sentiments concerning time and languages.
2. Methods and experiments
To create training and test dataset, 1,000 tweets were randomly selected from each language and four students from different backgrounds were involved in the labeling. The technique used to analyze the general sentiment of the tweets is a mixed method of dictionary and SVM, which yields satisfactory results while avoid being too complicated. Currently, all the classifiers mentioned below are combinations of a trained SVM and positive-negative dictionaries.
Firstly, a relevance classifier would decide whether a tweet is relevant to the topic. For example, some tweets may be talking about the French National Day or the recent riots and chaos in Hong Kong and were mistakenly collected. These irrelevant tweets shall be excluded from the follow-up steps. Secondly, tweets written in Chinese would be categorized according to their typeface, say,simplified or traditional Chinese. Thirdly, another classifier would judge whether the tweet is simply stating a fact or is expressing certain kinds of affection. Those tweets with an affection would then be sent to the last classifier which determines the sentiment of the tweet (positive or negative). After training on the labeled data set and manually adjusting the dictionaries, all these classifiers have reached an average accuracy of over 90%, with several of them near 100%.
3. Results and Visualization
Basic facts with graphs are provided in this section.
3.1 Temporal analysis
Please aware that in this part, the data collected in Sept 29, Sept 30 - Oct 3, and Oct 5 - Oct 8 are concatenated.
3.1.1 The number of English tweets concerning the Chinese National Day are shown below. The peak is around 18h, Oct 1:
.jpg)
The number of Chinese tweets concerning the Chinese National Day are shown below. The peaks is include 22h Sept 30, 10h Oct 1, 20h Oct 1, 7h Oct 7, etc:
.jpg)
3.1.2 The absolute sentiments towards China are calculated by subtracting the number of negative tweets from the number of positive tweets. And the result for English tweets are shown below. The lowest point is around 18h Oct 1:
.jpg)
The result for Chinese tweets are shown below. The peaks are 1h, 4h, 10h, and 20h Oct 1:
.jpg)
3.1.3 The normalized positive sentiments are obtained by dividing the number of positive tweets within a time period by the number of all the tweets collected within this time period. The normalized negative sentiments can be calculated in the same way. And the normalized sentiments is the difference between the normalized positive sentiments and the normalized negative sentiments. The result for English tweets are: (The blue, green, and red lines are the normalized positive sentiments, the normalized negative sentiments, and the normalized overall sentiments, respectively)
.jpg)
The result for Chinese tweets are:
.jpg)
The figures for simplified Chinese and traditional Chinese are also available. If you are interested, you may contact me for more information.
3.2 Spatial Analysis
Some Twitter users chose to provide their location information in the profile, which enables us to conduct geological analysis. The following link contains eight interactive maps.
The first one shows the number of positive English tweets sent from different countries. There are two buttons at the top of the map. Selecting the left one gives the absolute number of the positive tweets (In this case, the bar at the buttom left corner is meaningless) while the right one offers the same data but scaled to the range of 0 to 100. Remember not to select both butons simultaneously, as the sum of the two doesn’t make much sense.
Similar to the first figure, the second picture shows the number of negative English tweets sent from different countries. Also, The third and the fourth pictures provide the number of Chinese tweets expressing positive or negative sentiments towards China.
The Fifth picture compares the number of positive and negative tweets written in English. The top left button shows the difference between the two. The results were scaled to 0-100 and 79 means the two numbers are equal, that is to say, if a country’s final score if larger than 79, then this country produces more positive tweets than negative ones. The middle button shows the division of the two number. The results were multiplied by 50. So if a country has a score larger than 50, it shows more positive overall sentiments towards China than negative. The top right button also provides the division of the two numbers, but the results were scaled to 0-100. Personally, I think the middle one gives the best result.
The sixth, seventh, and eighth picture compares the number of positive and negative tweets written in Chinese (combining simplified and traditional Chinese), simplified Chinese, and traditional Chinese in the same way as stated above.
The maps for the numbers of positive and negative tweets written in simplified and traditional Chinese are also available. If you are interested, you may contact me for more information.
3.3 Keywords
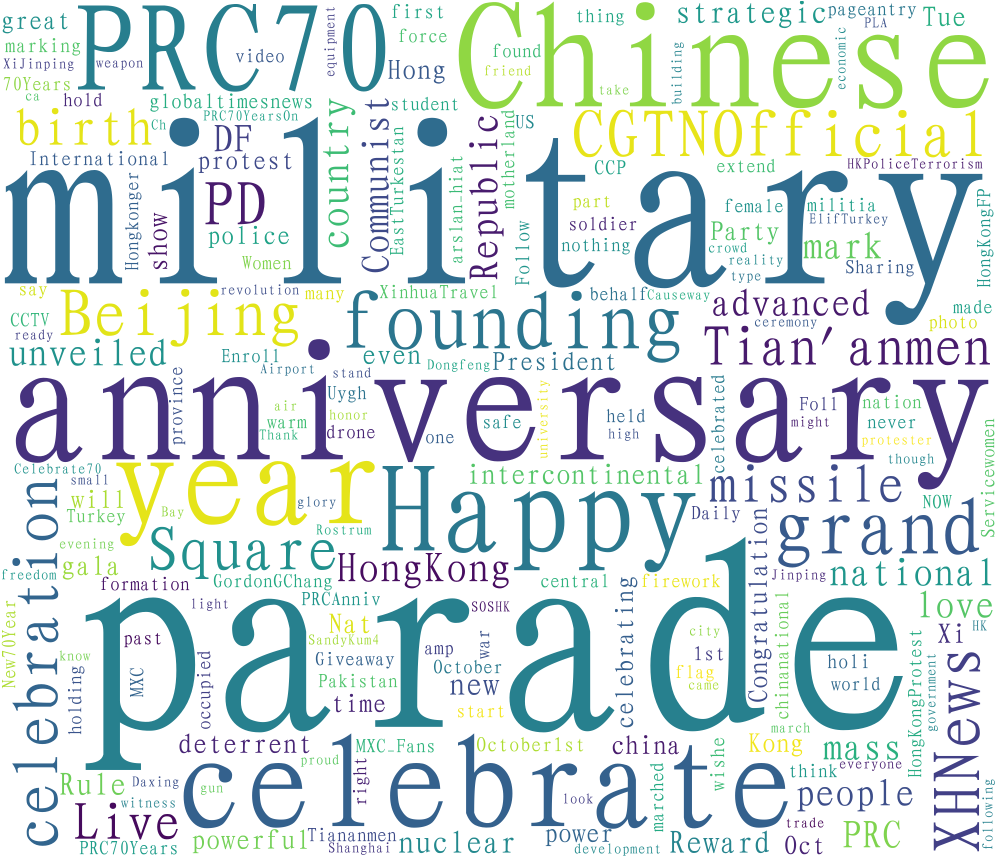
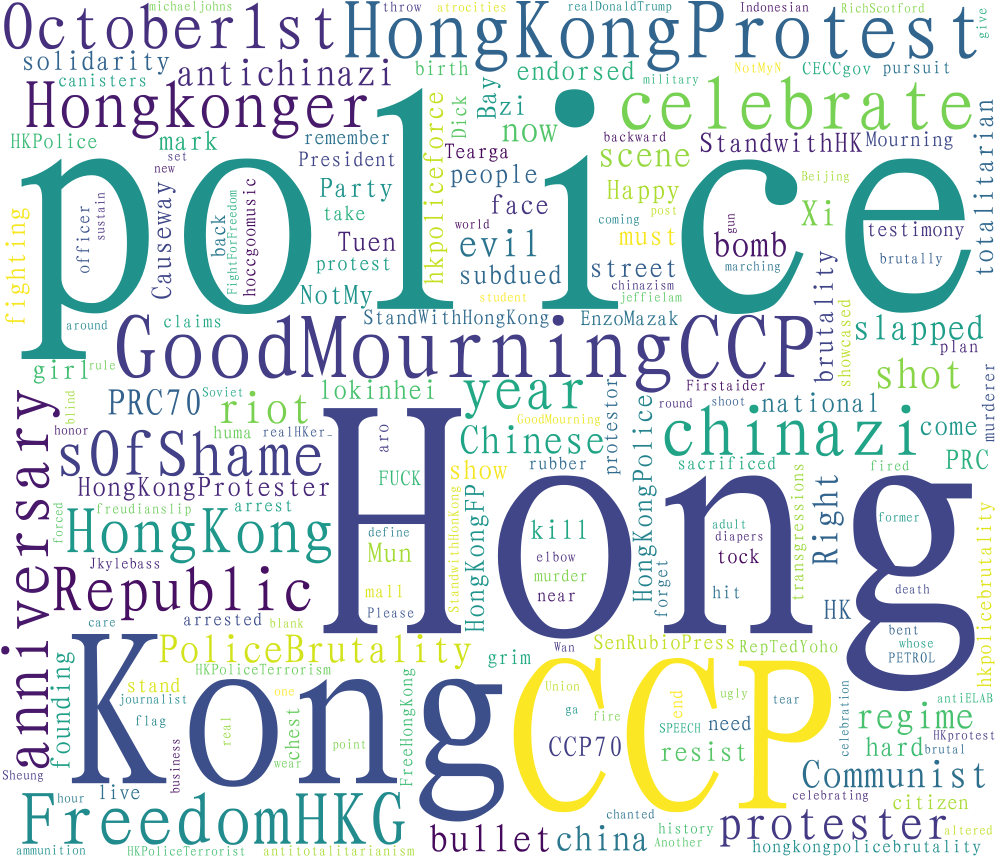
3.3.1 For English tweets with positive sentiments towards China, the most frequenly mentioned words are shown bottom left, and the negtive bottom right:
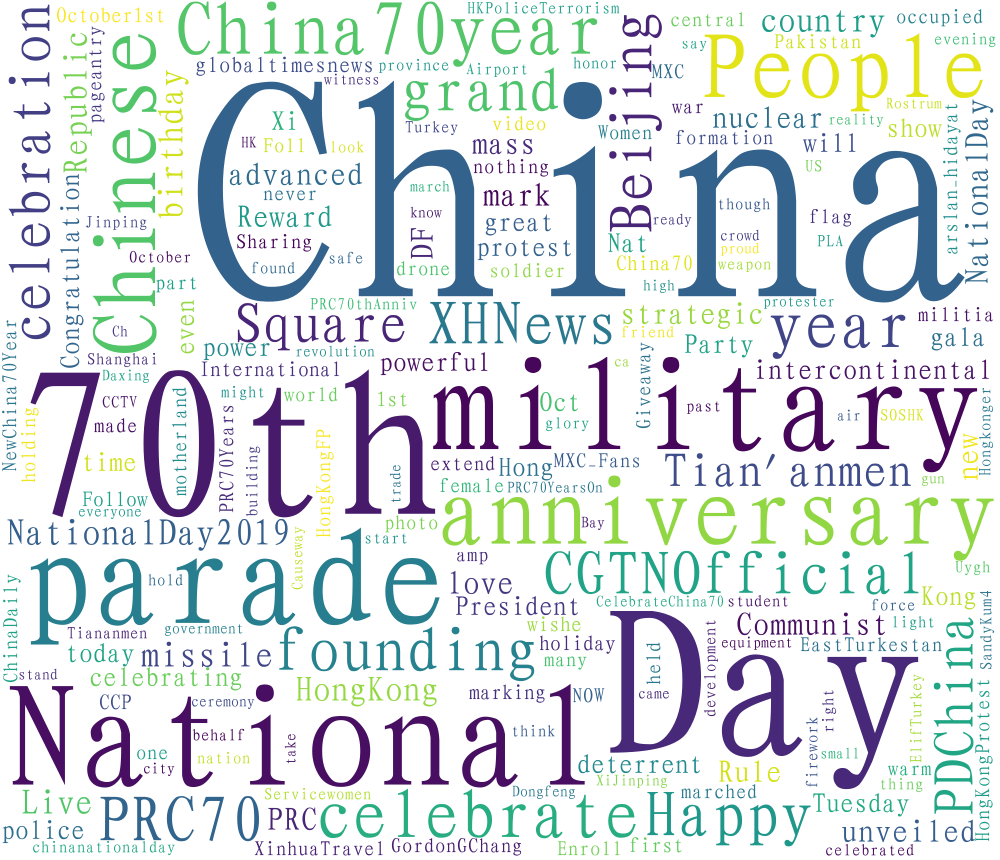
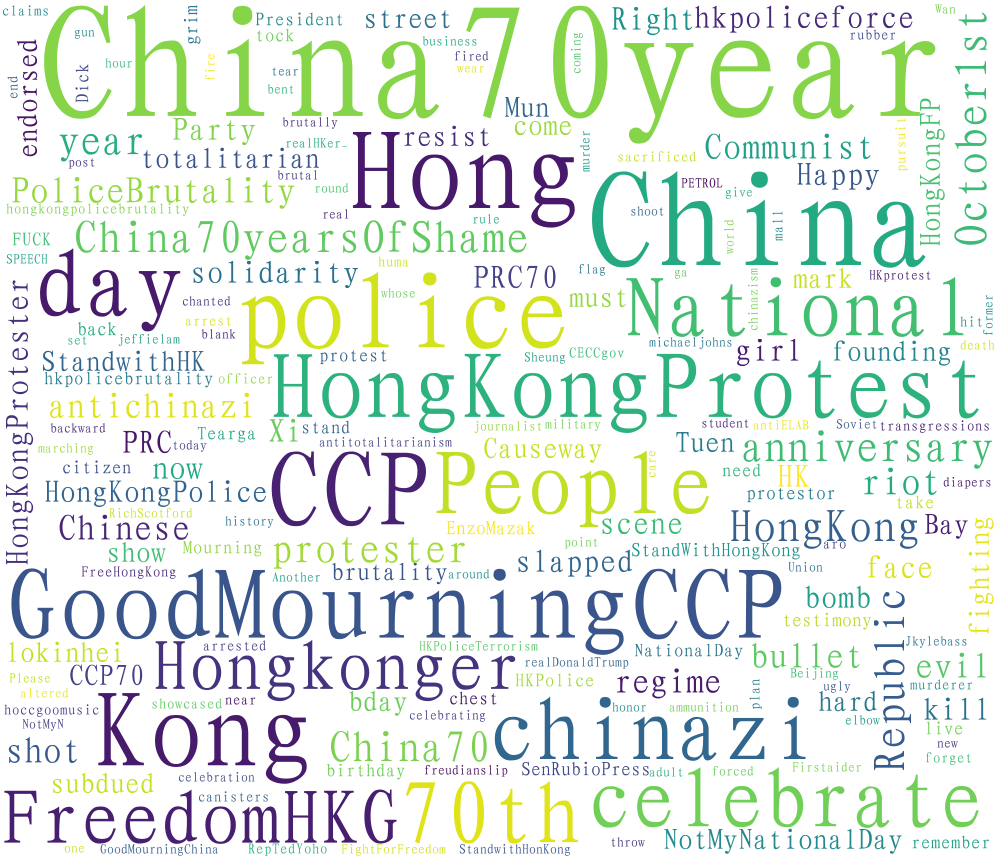
Deleting the words that are contained in both graphs, the results would become:
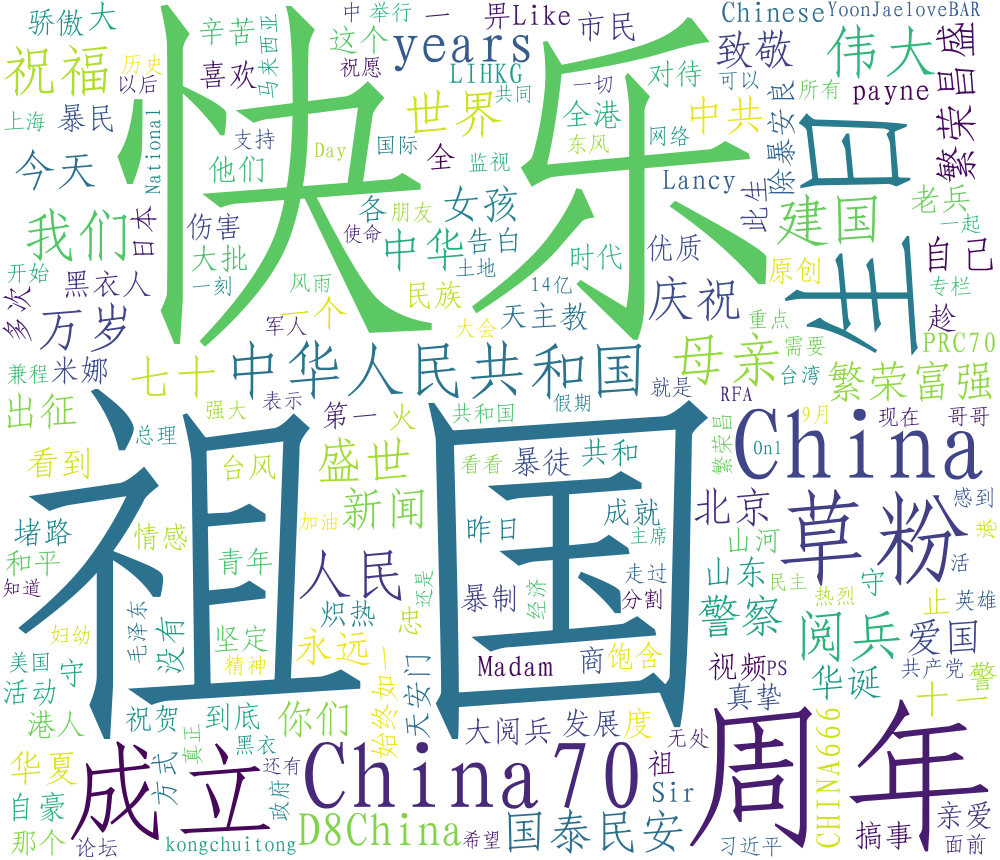
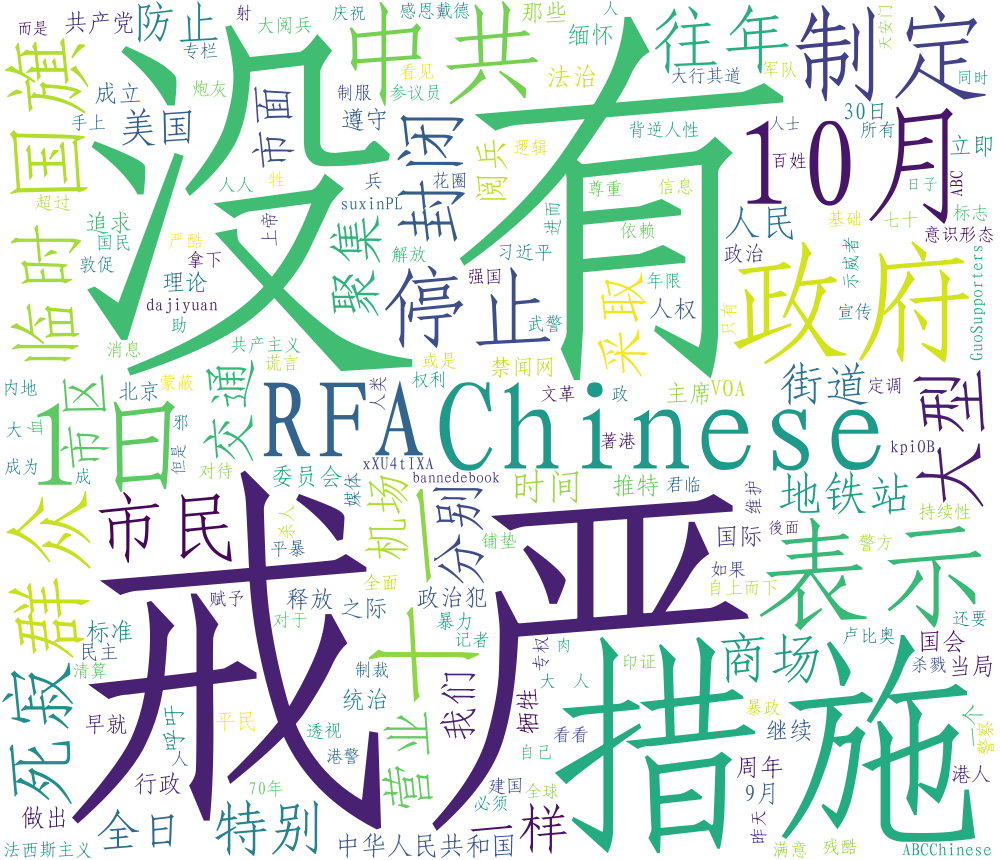
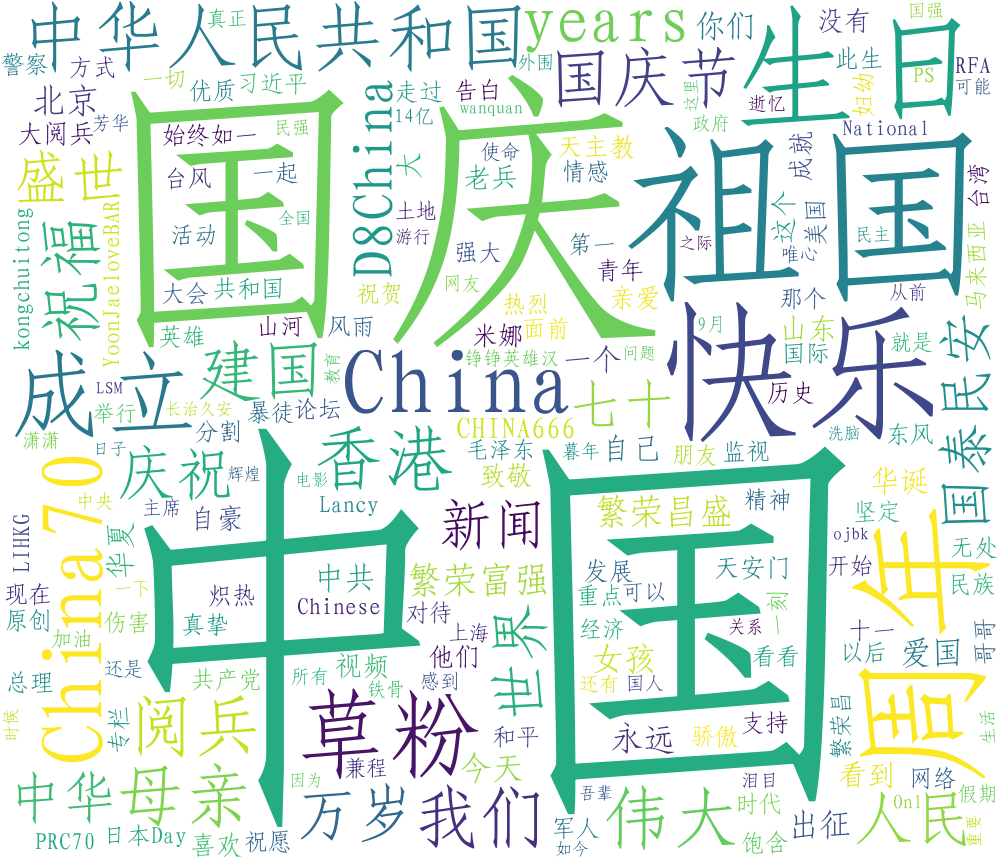
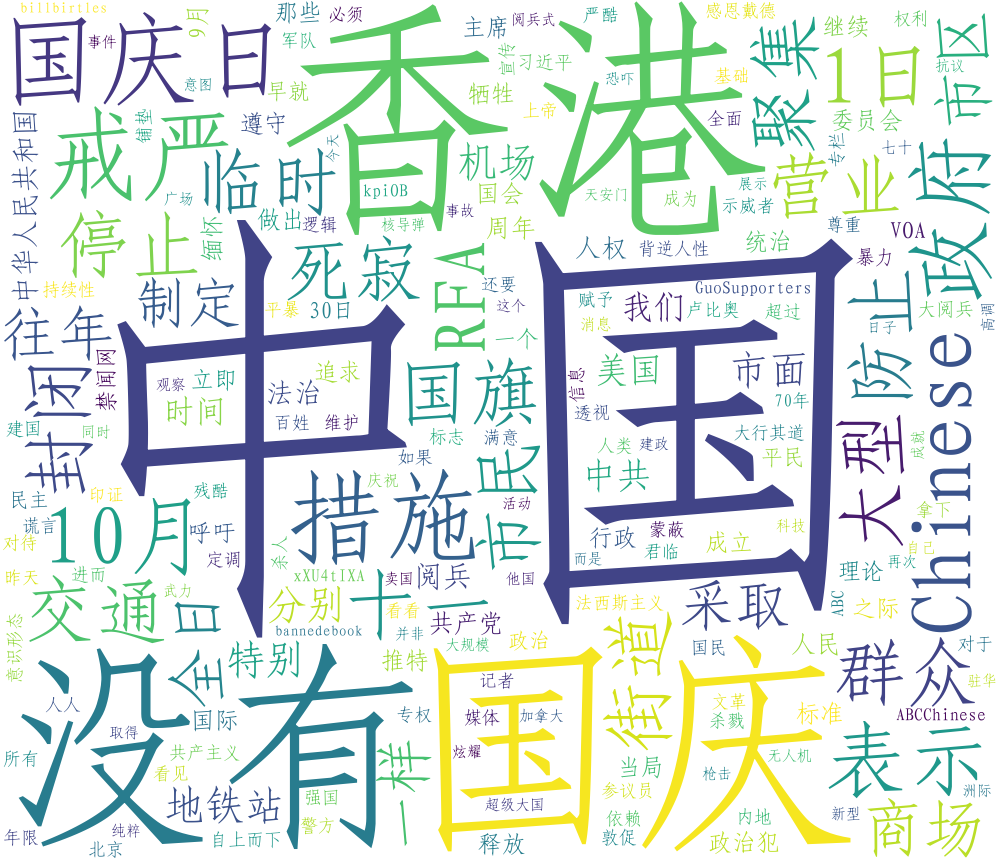
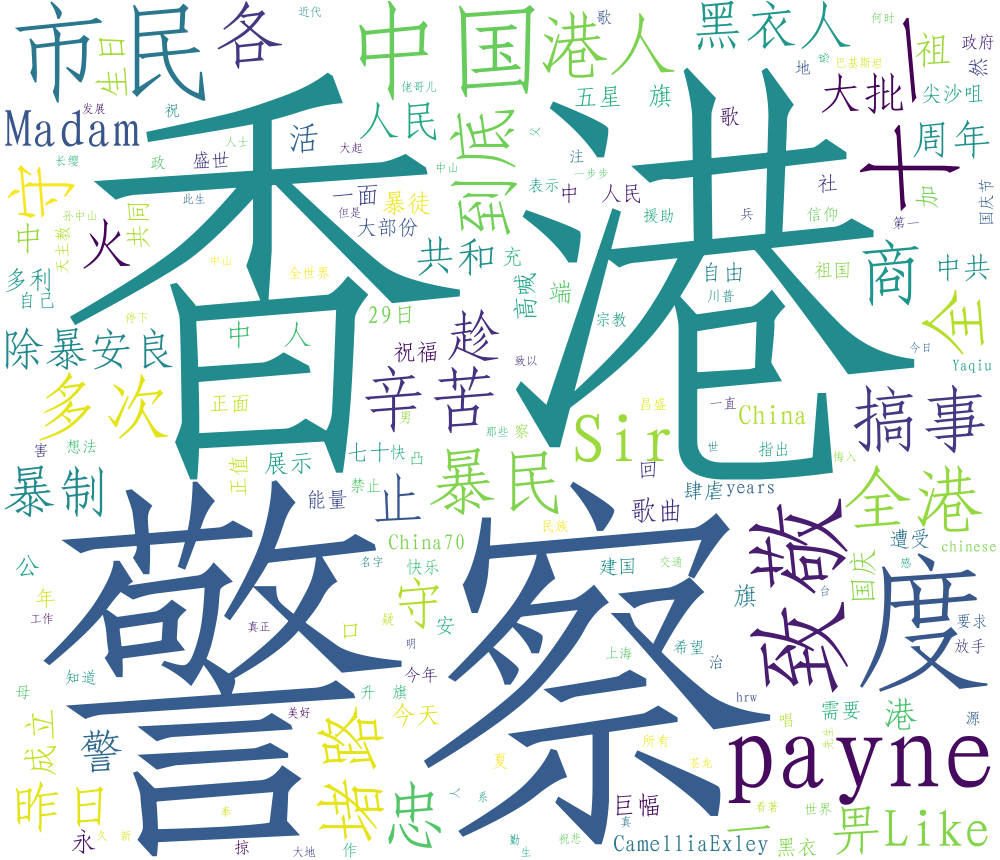
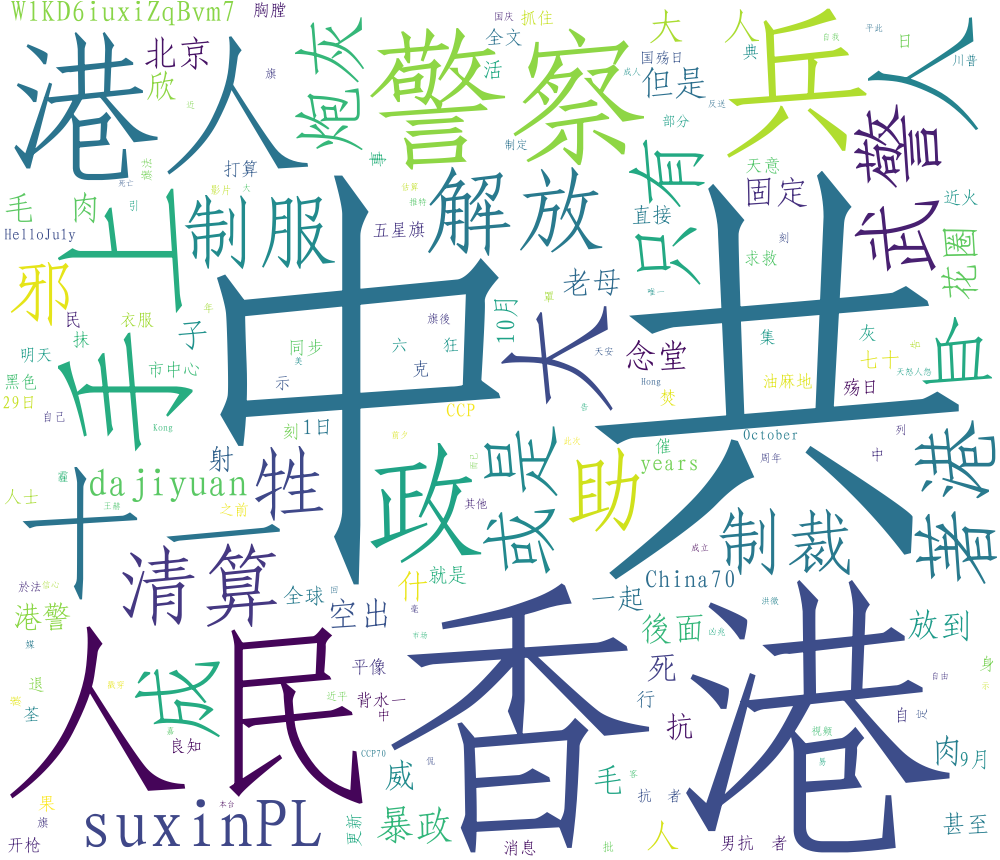
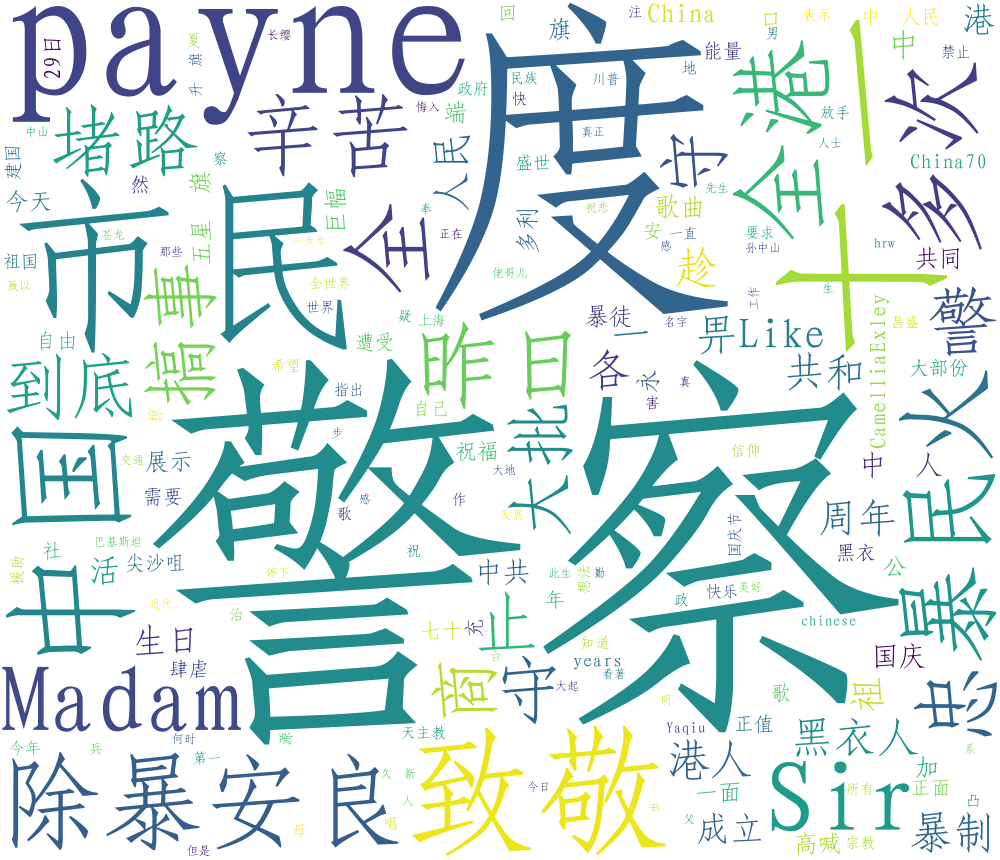
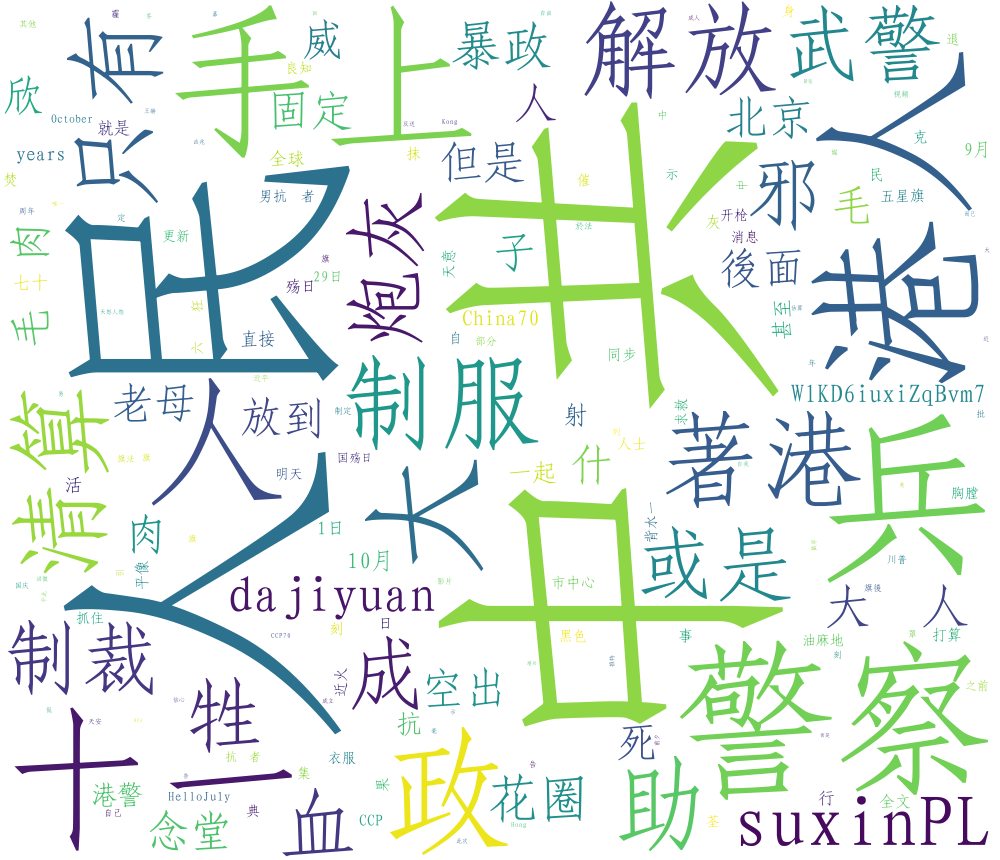
3.3.2 For Chinese (including both simplified and traditional Chinese) tweets with positive sentiments towards China, the most frequenly mentioned words are shown bottom left, and the negtive bottom right:
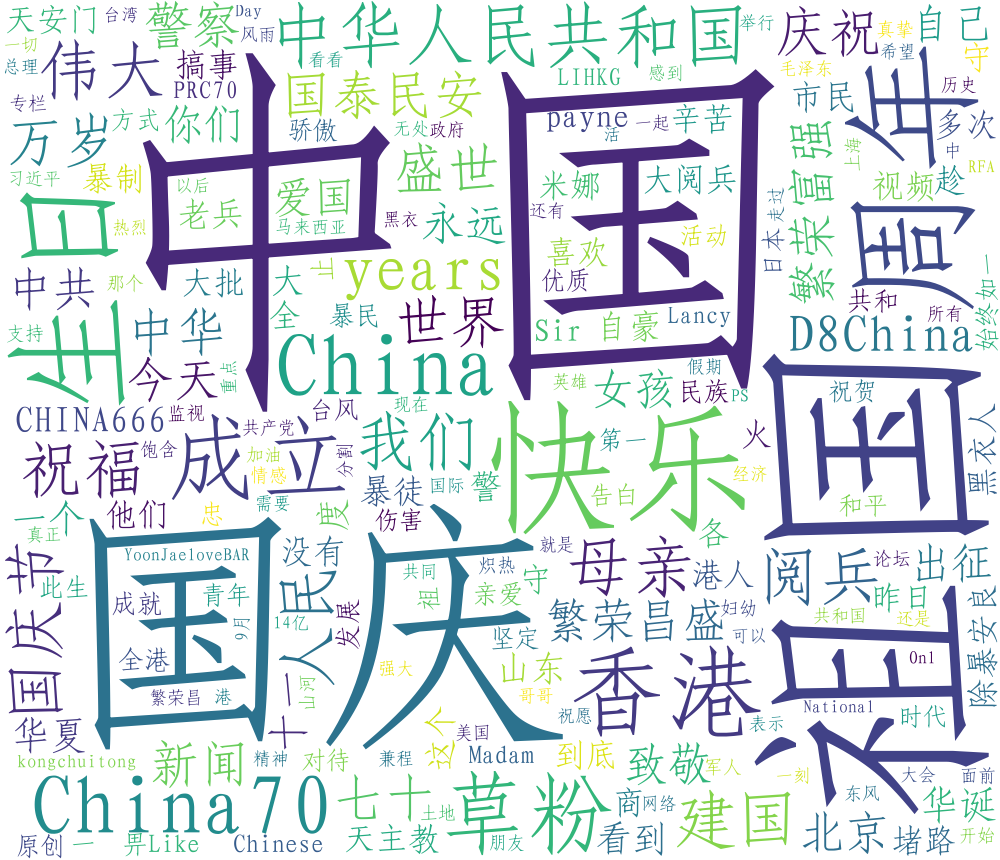
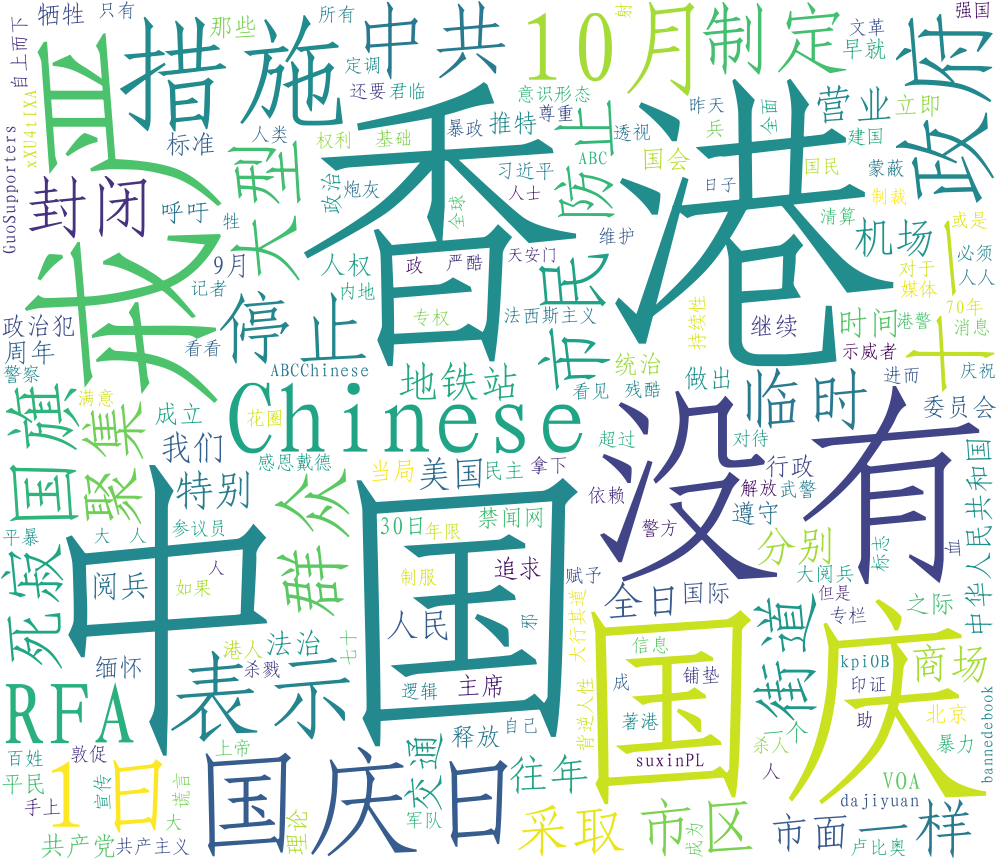
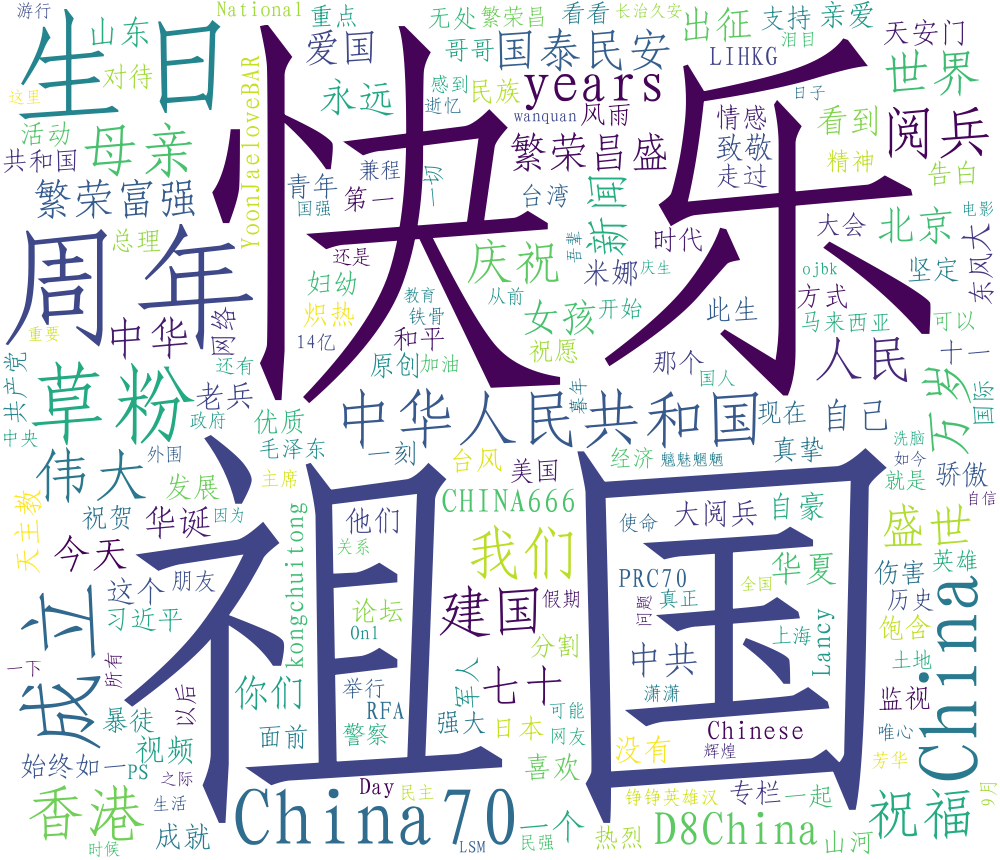
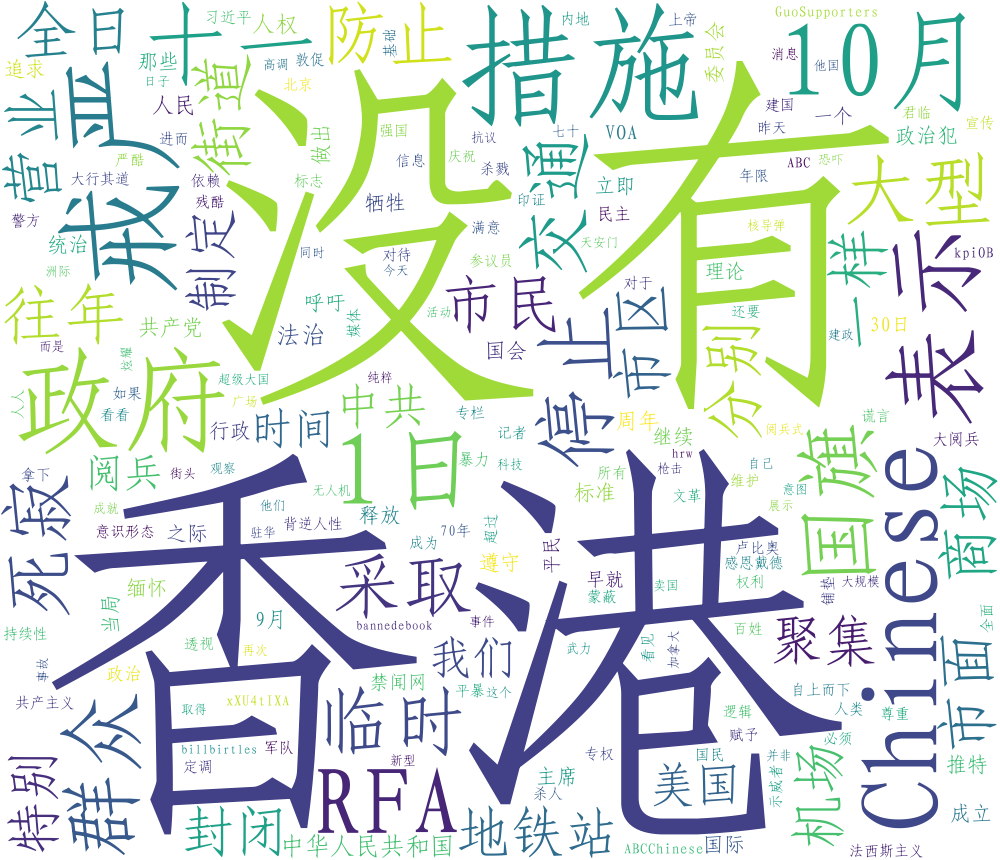
Deleting the words that are contained in both graphs, the results would become:
3.3.3 For simplified Chinese tweets with positive sentiments towards China, the most frequenly mentioned words are shown bottom left, and the negtive bottom right:
Deleting the words that are contained in both graphs, the results would become:
3.3.4 For traditional Chinese tweets with positive sentiments towards China, the most frequenly mentioned words are shown bottom left, and the negtive bottom right:
Deleting the words that are contained in both graphs, the results would become:
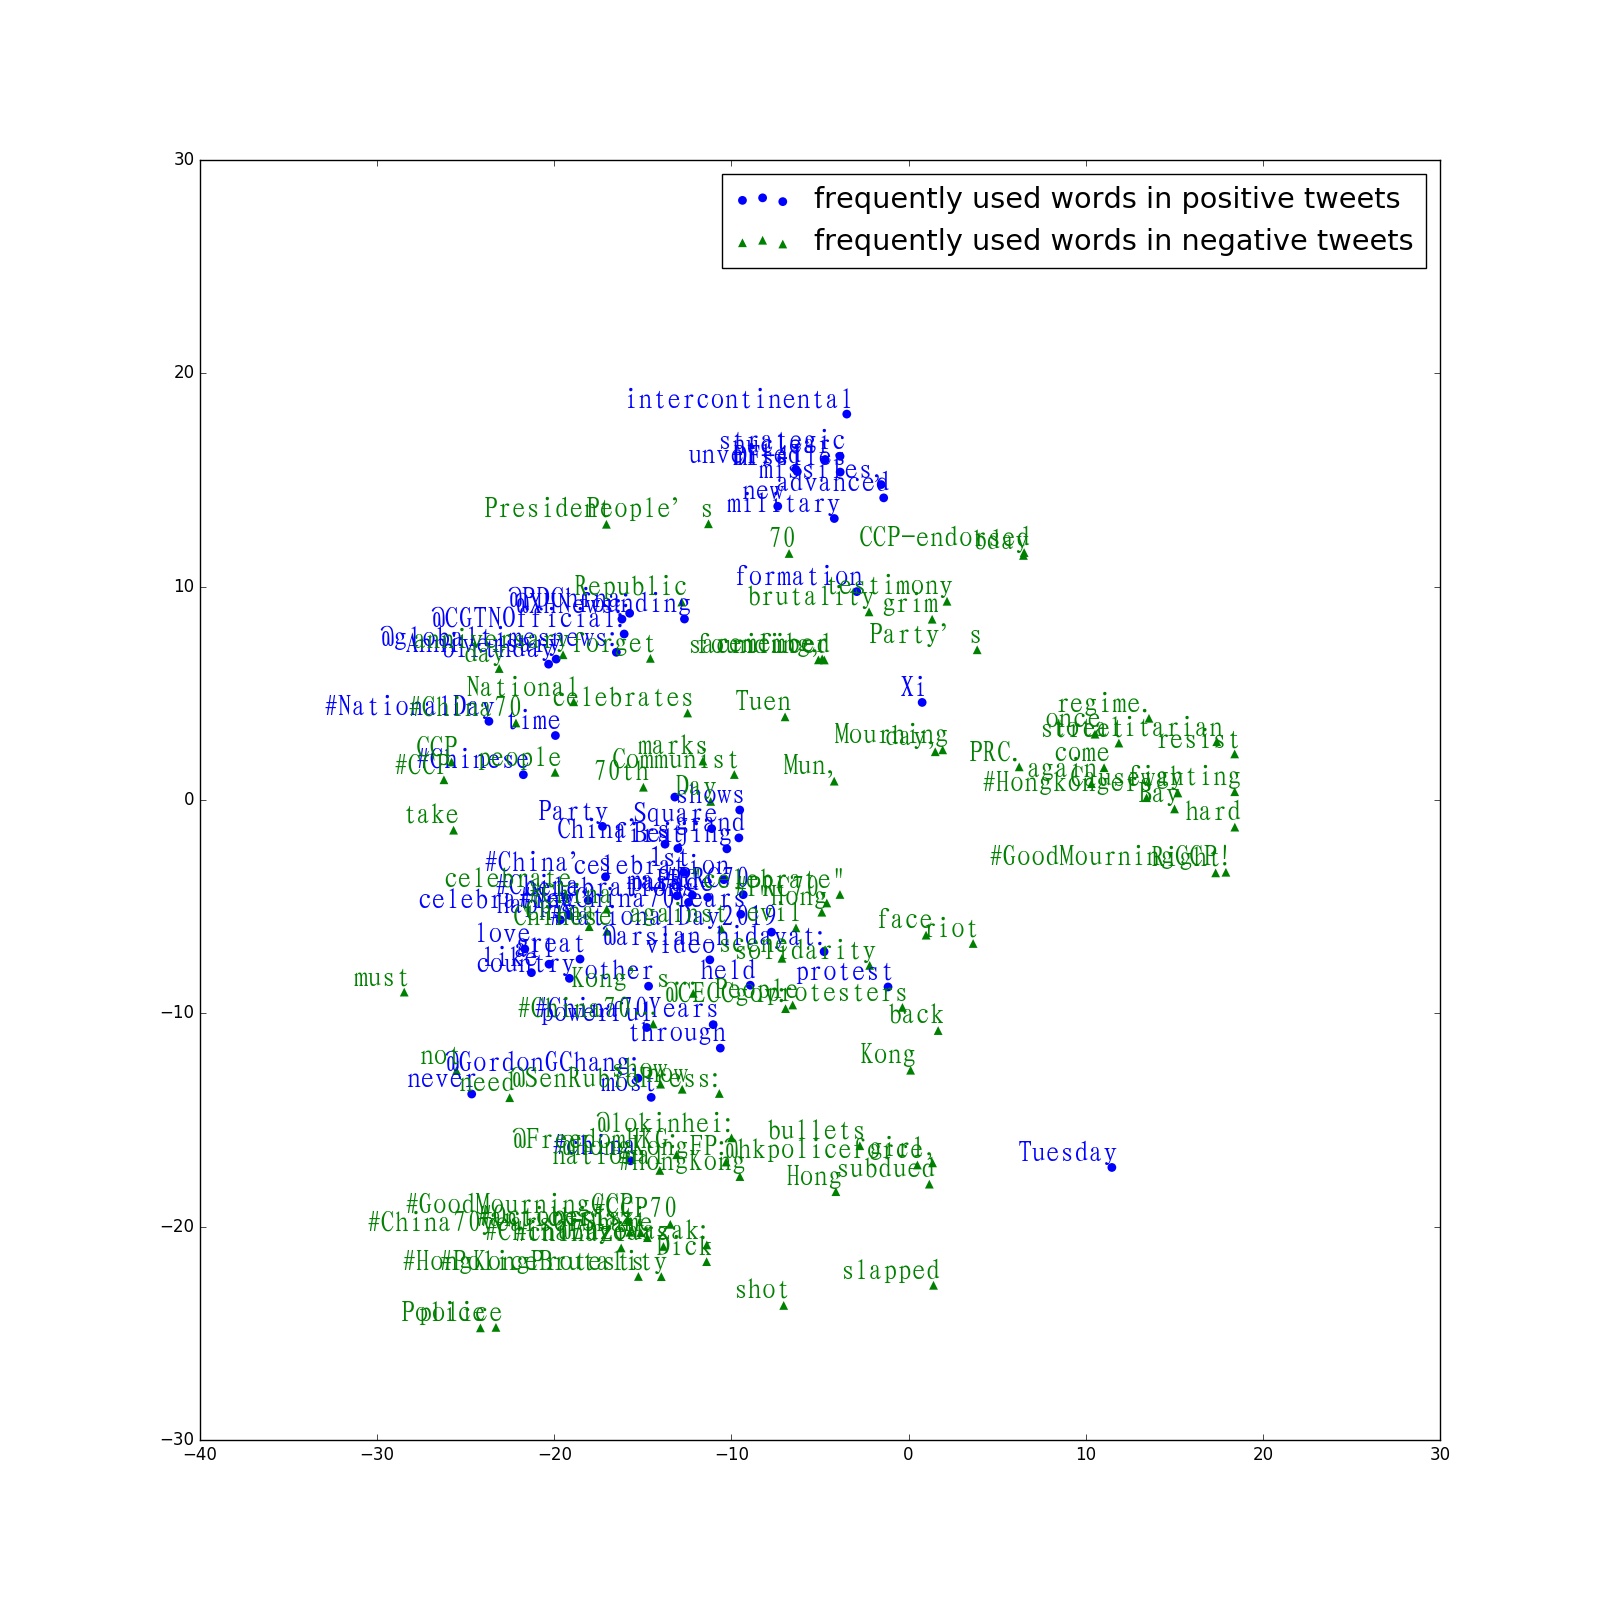
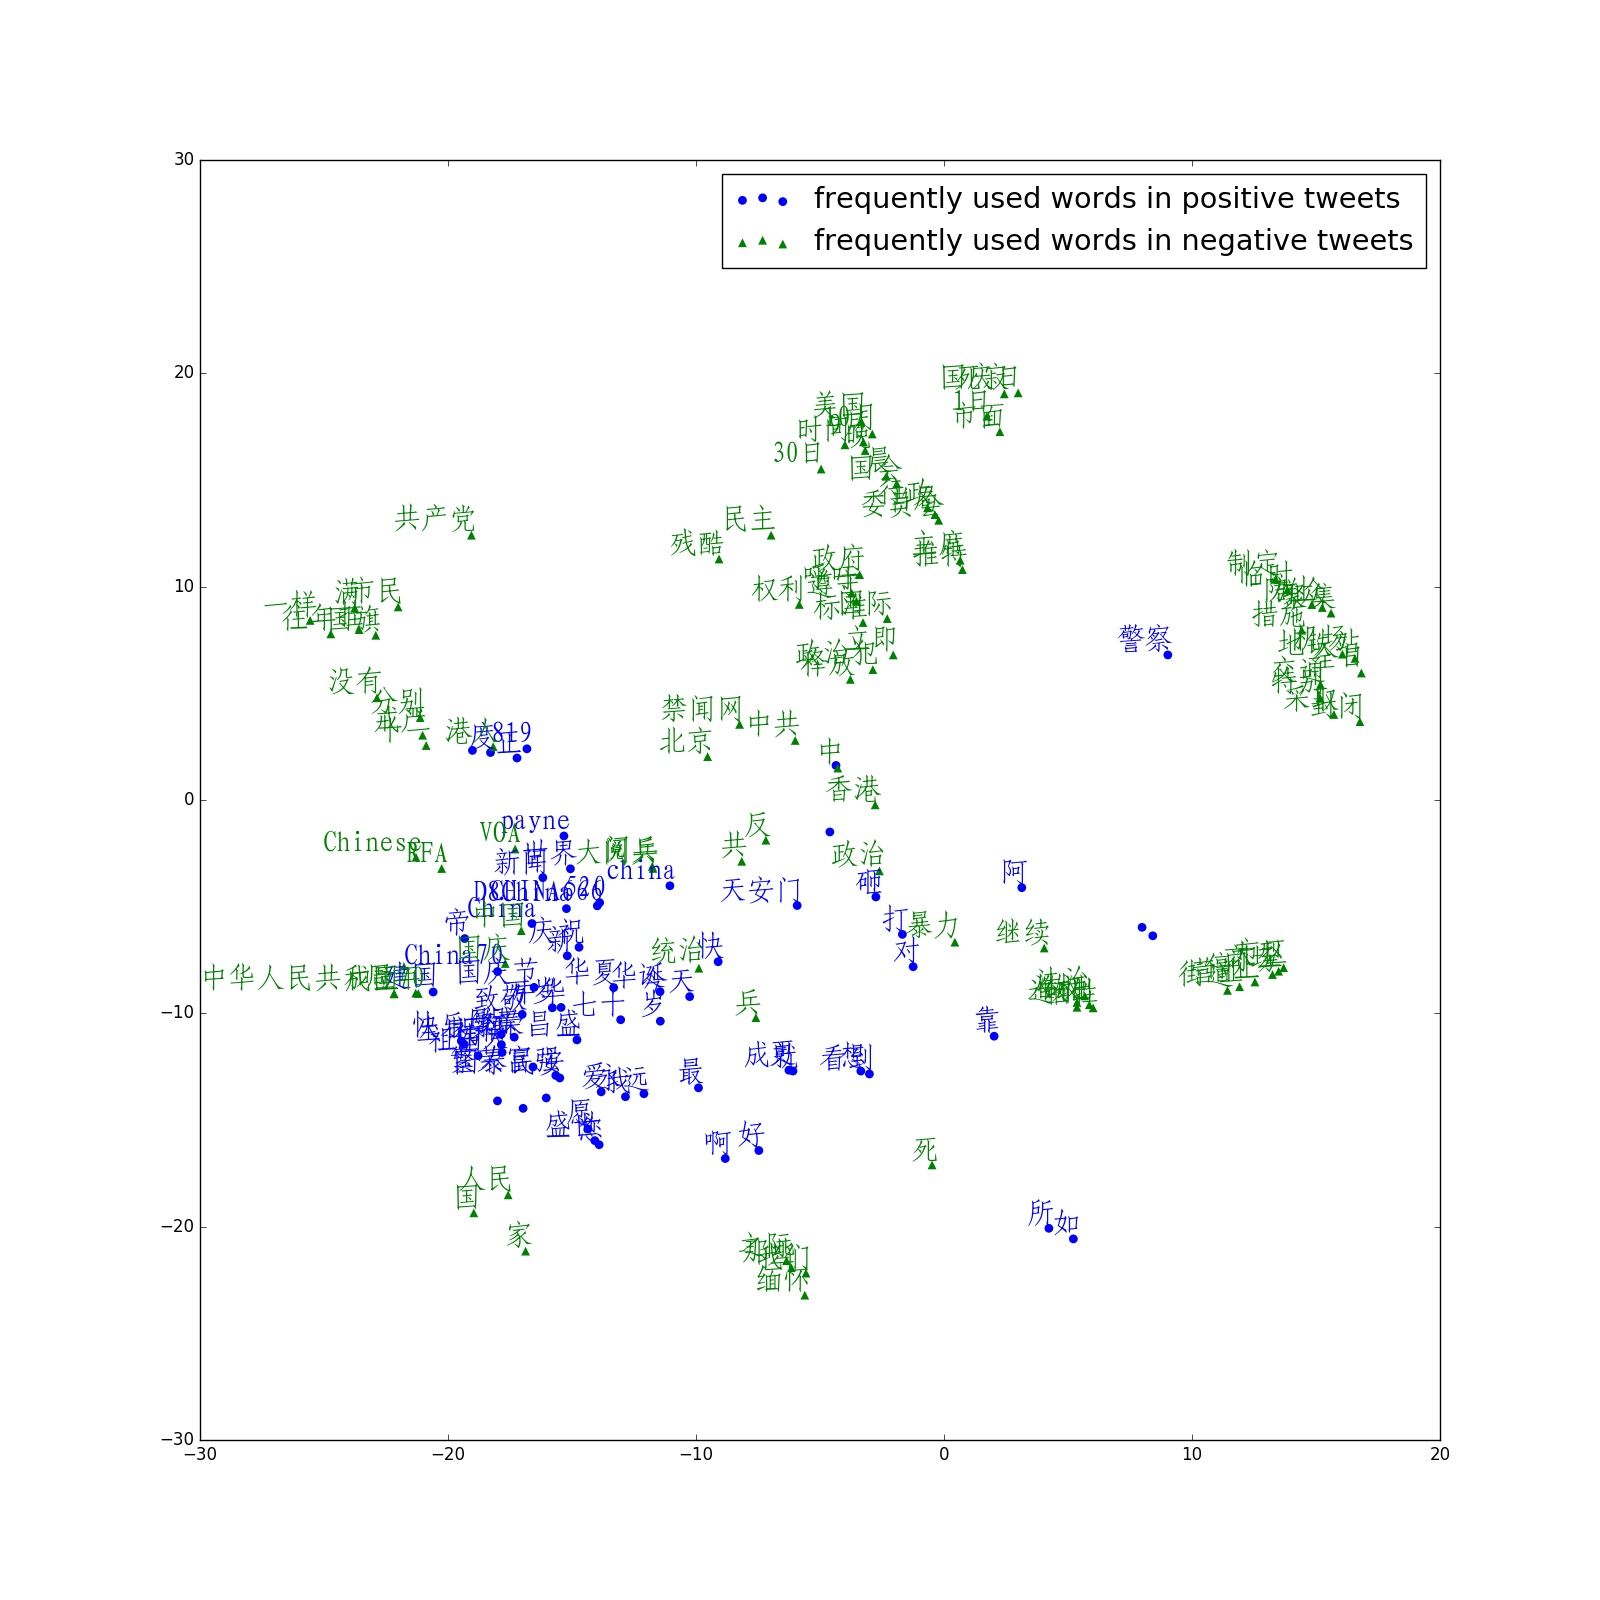
3.3.5 Also, word vectors for the top 100 frequently and uniquely used words for both English and Chinese, positive and negative tweets were obtained through word2vec. Their dimension was initially 200, and was reduced to 2 with t-SNE algorithm. See bottom left for word vectors of English tweets and bottom right Chinese tweets.
4. Future analysis
Analysis from the political aspect may focus on the causes of the phenomenon shown above. A country’s relationship with China, its location (e.g. whether located along the Belt and Road), as well as the major laguage used within the country shall all be considered.